

Eric Holder, the 82ndAttorney General of the United States, gave the keynote address. Talking to a room full of geographers he took the safe route, stating ‘I love maps’ (applause) ‘I do, I love them!’ (more applause).
But maps are not only a proclaimed love of Mr Holder’s, they’re at the very centre of his current job as Chairman of the National Democratic Redistricting Committee (NDRC) which aims to tackle gerrymandering.
What struck me, though, was not that he argued for dealing with the truly problematic practice of gerrymandering, but that he made it sound like something new and exclusively Republican when, truly, it’s neither. It goes back to 1812 when Elbridge Gerry, Governor of Massachusetts, created a new districting plan for the Massachusetts Senate and it’s been a contentious issue ever since. Here’s a paper published in 1966 on the geographical aspects of gerrymandering,here’s one from 1985 discussing gerrymandering and proportional representation, and here’sa really interesting one from 2016, showing that the much critiqued 2012 election, when Democratic candidates won only 201 of the 435 House seats despite getting the overall majority of votes nationwide, was only negligibly effected by gerrymandering.
That’s on a national level, though. On a state level, gerrymandering has had detrimental consequences and there’s no denying that one side of the political aisle has been far better at it than the other. But not necessarily for lack of trying. It’s not a matter of one (corrupt) side doing it and the other (virtuous) side trying to put it to an end, that’s a blatant and deeply unhelpful case of othering. Binary thinking, ones and zeros, you’re either this or you’re that and that one thing defines you.
It reminds me a bit of the maps by Ste Kinney-Fields of what it would look like if only [insert category here] voted. Well-intended, deeply fascinating, and horribly misused. The one of only women voting spread like wildfire across social media. It seemed to reaffirm the notion that women are just so much more sensible, so much less prone to hyperbole. There would be no wars if women were in charge. It’s taking the maddening complexity of human beings and simmering it down until only dregs remain, calling it essence without ever thinking of what got lost in the process. Yes, there would be wars if women were in charge.
The next map experience I’d like to share with you is the project Mapping Southerness. As part of the Southbound project, it aims to encapsulate the very quintessence of the American South, ultimately aiming to answer the question ‘where is the South’? They created a series of interactive maps based on features and practices deemed, somehow, typically southern, including ‘chickens’, ‘churches’, and subscriptions to the magazine ‘Garden & Gun’ (I looked it up, it’s a magazine about food, travel, and art, but that also contains such gems as ‘Are paper shotgun shells ripe for a revival: why some shooters are ready for a blast from the past’). The maps show each category separately as well as the aggregate, or what they term ‘The Index of Southernness’. Presenting it to local communities, people often felt reaffirmed in where the real South is and, equally, where it isn’t: ‘I’ve always said Grady County ain’t Southern!’ A beautiful and never-ending loop of mapping place and placing maps.
Finally, meet Anja Novković. She spent three years mapping the minute and mundane practices taking place in a little alleyway in downtown Montréal. In the context of urban renewal, she chose to ask ‘what’s already there?’ She gave a talk that took me from thinking ‘you did what for three years?’ to being convinced that the woman is simply brilliant. One of those things I wish I had the creativity, resolve, and artistic talent to do myself. Her maps include rat sightings, crying, smoking, hugging, and the occasional murder. With her permission, I’ll end this map musing with two of the maps she presented during her talk.

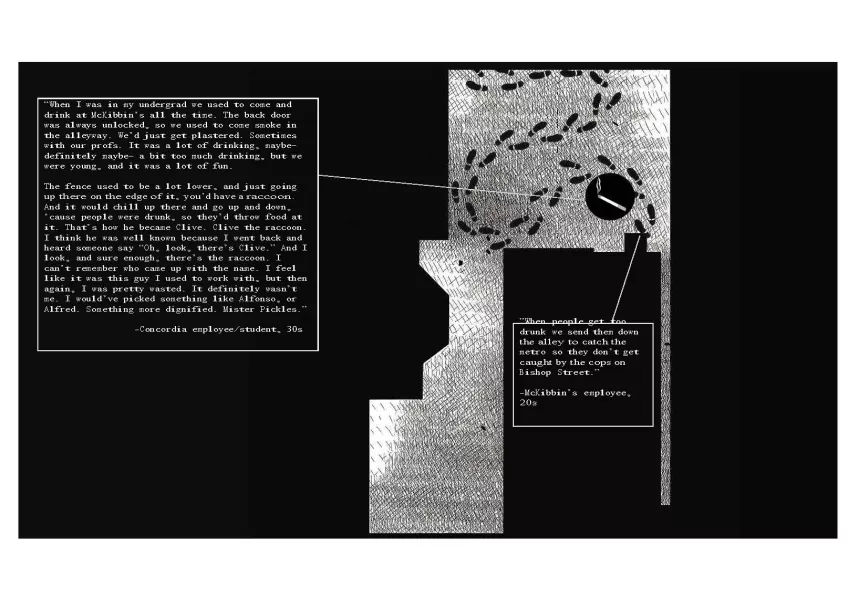
Klick on the image for a larger version. Maps by: Anja Novković.